Enterprise Roadmap: Complete Tableau to Power BI Guide, Steps, and Tool Evaluation
 0|
0| 0
0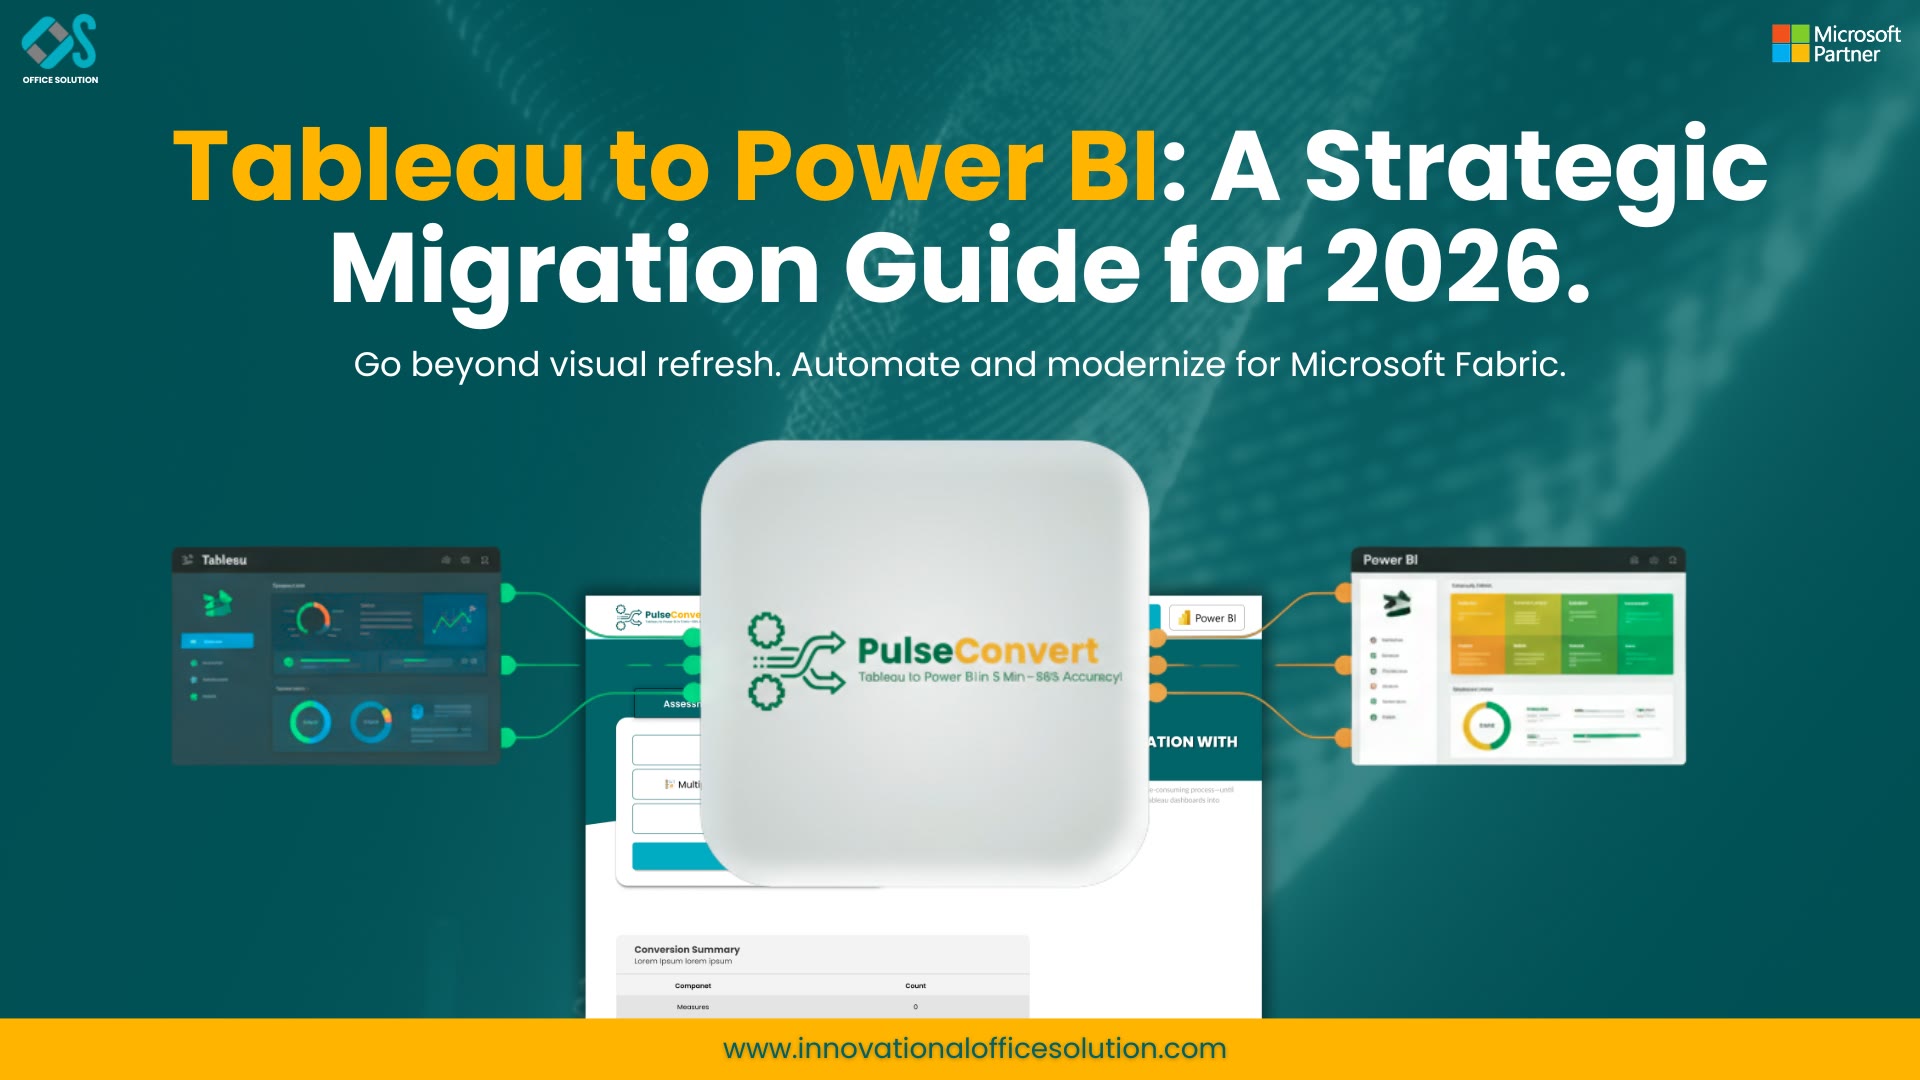
Table of Contents
Executive Overview: Modernizing Your BI Infrastructure
Enterprise business intelligence is entering a new phase of consolidation and modernization. For over a decade, standalone visual discovery platforms dominated corporate reporting. However, as cloud data architectures evolve toward unified lakehouses, real-time analytics, and embedded AI, technology leaders are re-evaluating their legacy reporting stacks. As a result, organizations across global markets are choosing to migrate from Tableau to Power BI to align with Microsoft Fabric, reduce total cost of ownership, and establish a single source of truth.
Executing a successful platform transition requires far more than recreating dashboards chart by chart. Without a structured Tableau to Power BI guide, enterprise teams face risks such as duplicated data engineering work, metric inconsistencies, and delayed adoption. To execute a smooth, zero-downtime transition, data architects must follow a defined Tableau to Power BI steps that cover workbook rationalization, semantic model design, automated conversion, and data validation.
This comprehensive guide provides an end-to-end framework for IT leaders, data architects, and BI managers. It details the strategic drivers behind migration from Tableau to Power BI, outlines actionable Tableau to Power BI migration steps, and evaluates why automated software accelerators are transforming how enterprises modernize their analytics.
Strategic Drivers: Why Enterprises Migrate from Tableau to Power BI
Understanding why companies choose to migrate from Tableau to Power BI is essential for building a compelling business case for executive stakeholders. While legacy visual tools excels at ad-hoc desktop exploratory graphics, modern enterprise analytics demands tight integration with cloud storage, enterprise identity management, and collaborative productivity suites.
The primary operational and economic drivers for this transition include:
Total Cost of Ownership Optimization
Maintaining standalone desktop and server licenses across thousands of enterprise users creates significant financial overhead. Shifting to Power BI leverages existing Microsoft 365 E5 or Azure Enterprise Agreements, drastically reducing licensing costs while expanding report access across the entire organization.
Unified Semantic Layer and Governance
In legacy reporting setups, business calculations are frequently embedded inside individual workbook files. This decentralization leads to conflicting metric definitions across departments. Transitioning to Power BI allows data teams to centralize calculated measures within shared semantic models, enforcing standardized governance through Microsoft Purview and Entra ID.
Ecosystem Integration and AI Capabilities
Modern business workflows require data insights directly within everyday collaboration tools like Microsoft Teams, PowerPoint, and SharePoint. Power BI provides native integration across the Microsoft ecosystem and includes built-in Copilot capabilities, allowing business users to generate natural language summaries, explore root causes, and build draft visuals dynamically.
Direct Lake and Cloud Lakehouse Integration
As organizations migrate data warehouses to platforms like Microsoft Fabric, Snowflake, or Databricks, legacy extract-based architectures become inefficient. Power BI offers Direct Lake and DirectQuery capabilities that query cloud lakehouses directly without duplicating data extracts, dramatically improving query speed and lowering storage costs.
Introducing Pulse Convert: The Best Tableau to Power BI Migration Tool
Rebuilding hundreds of complex enterprise dashboards manually represents a major operational bottleneck. Manually recreating visual layouts, re-establishing data bindings, and translating complex calculated fields into Data Analysis Expressions (DAX) requires thousands of developer hours and introduces risk into critical financial formulas.
To eliminate these conversion challenges, Office Solution AI Labs developed Pulse Convert, an enterprise-grade automated software engine designed specifically to streamline platform transitions. Introducing Pulse Convert into your modernization workflow shifts your engineering strategy from slow manual reconstruction to automated extraction, translation, and validation. The tool programmatically parses legacy Tableau workbook XML schemas, extracts embedded calculations, maps underlying schemas, and generates native Power BI report templates (.pbix files) alongside semantic datasets.
By utilizing advanced semantic parsing and formula translation algorithms, Pulse Convert delivers an automated accuracy rate of 75% to 90% across standard workbooks, calculated fields, dynamic parameters, and canvas layouts. This high level of automation reduces overall project delivery timelines by up to 60%, drastically lowers conversion expenses, and allows data engineers to focus on performance tuning, security configuration, and governance rather than tedious visual design. Enterprise teams evaluating software options consistently recognize Pulse Convert as the best Tableau to Power BI migration tool for enterprise-scale modernization.
To learn more about how this technology can accelerate your organizational transition, explore the full capabilities available at Office Solution AI Labs.
Evaluating the Best Tableau to Power BI Migration Tool Options
When selecting software tools to support your transition, IT leads must establish strict technical criteria. The ideal tool must go beyond copying static visuals; it must understand underlying data models, handle complex nested formulas, and generate clean, maintainable DAX code.
When evaluating software options, enterprise architects should assess tools against five core capabilities:
Automated Formula Parsing and LOD Translation
The software must parse Level of Detail (LOD) expressions—such as FIXED, INCLUDE, and EXCLUDE—and map them into context-aware DAX functions (CALCULATE, ALLEXCEPT, REMOVEFILTERS) without manual intervention.
Schema Mapping and Query Conversion
The tool must automatically map data source connections, custom SQL statements, and join logic directly into Power Query M script or Tabular Object Model (TOM) definitions.
Visual Layout Preservation and Canvas Mapping
It should automatically replicate visual placements, color palettes, fonts, dynamic filters, and slicer positions to maintain visual familiarity for end users.
High Accuracy and Low Post-Processing Effort
Enterprise tools should deliver initial automation accuracy rates between 75% and 90%, ensuring developers spend minimal time adjusting converted files.
Enterprise Security and Cloud Compliance
The tool must run securely within your cloud tenant or enterprise boundary, protecting sensitive business metadata and proprietary calculation logic throughout the conversion lifecycle.
Comprehensive Step-by-Step Execution Framework
Following a structured set of Tableau to Power BI migration steps is essential to ensure project predictability, data precision, and zero disruption to business operations.
Step 1: Asset Inventory, Audit, and Rationalization
Begin by conducting a thorough audit of your reporting repository. Extract usage metrics from server metadata to identify active workbooks, viewer frequency, and report owners.
- Retire: Eliminate obsolete or unviewed dashboards (often 30–40% of legacy workbooks).
- Consolidate: Merge redundant reports across departments into unified, interactive Power BI reports.
- Re-architect: Redesign reports with inefficient custom SQL queries or legacy data blends into streamlined star schemas.
- Convert: Flag high-value, active reports for automated platform conversion.
Step 2: Semantic Model Architecture and Data Gateway Setup
Before converting individual visual files, build a centralized semantic layer. Following the "Semantic Layer First" architecture published on the Microsoft Tech Community, architects consolidate data sources into shared star-schema datasets. Set up Power BI Enterprise Data Gateways for secure access to on-premises databases and establish data refresh schedules.
Step 3: Automated Conversion Execution
Process prioritized workbooks through Pulse Convert. The tool automatically converts data bindings, translates calculated fields into DAX, transforms data queries into Power Query M scripts, and maps visual canvas elements into native Power BI (.pbix) files.
Step 4: Quality Assurance, DAX Refinement, and Data Validation
After automated conversion, data engineers perform targeted reviews:
- Review complex translated measures to ensure correct evaluation within Power BI filter contexts.
- Perform automated data validation, comparing query output values between legacy reports and new Power BI datasets across identical filter selections.
- Optimize report load performance using Power BI Performance Analyzer and DAX Studio.
Step 5: Enterprise Deployment, Governance, and User Onboarding
Publish verified semantic models and reports to secure Power BI Workspaces. Configure Row-Level Security (RLS) policies matching legacy access permissions, set up automated refresh schedules, and distribute reports via Power BI Apps. Deliver structured training workshops to help end users adapt to Power BI's interactive navigation, export functions, and mobile views.
Technical Translation: Level of Detail (LOD) Expressions to DAX
A key technical hurdle when you migrate from Tableau to Power BI is translating Level of Detail (LOD) expressions into DAX measures.
In legacy workbooks, LOD expressions control calculation granularity independently of worksheet dimensions. In Power BI, context is managed through DAX filter context and row context.
| Calculation Type | Legacy Formula Logic | Equivalent Power BI DAX Pattern | Practical Application |
|---|---|---|---|
| FIXED LOD | {FIXED [Region] : SUM([Sales])} | CALCULATE(SUM(Sales), ALL(Table), Table[Region]) | Calculates regional sales totals regardless of canvas visual filters. |
| INCLUDE LOD | {INCLUDE [Customer] : AVG([Sales])} | SUMX(VALUES(Table[Customer]), CALCULATE(AVG(Sales))) | Aggregates metrics at a finer detail level than displayed in the chart. |
| EXCLUDE LOD | {EXCLUDE [Category] : SUM([Sales])} | CALCULATE(SUM(Sales), REMOVEFILTERS(Table[Category])) | Calculates totals while explicitly ignoring specific dimension filters. |
Automated conversion engines like Pulse Convert process these syntax transformations automatically, ensuring business calculations remain mathematically identical across systems.
Managing Change and User Enablement
A successful migration from Tableau to Power BI depends as much on user adoption as it does on technical implementation. Users accustomed to legacy interfaces may initially experience friction when adapting to Power BI's interactive behaviors.
To drive organizational adoption:
- Establish a Center of Excellence (CoE): Form a central BI team to publish design templates, set governance policies, and offer technical assistance during the transition.
- Deliver Role-Based Enablement: Provide tailored training paths for report consumers, business analysts, and data engineers. Consumers need quick overviews of navigation and exports, while developers require deep dives into DAX, star schemas, and Power Query modeling.
- Maintain Parallel Environments Briefly: Run legacy and new systems side by side for a short, defined window (e.g., 30 days) during user acceptance testing to build confidence in data consistency before retiring legacy infrastructure.
Strategic Value and Enterprise ROI
Completing a structured platform modernization delivers substantial financial and operational benefits across the enterprise:
- Direct Cost Reduction: Licensing expenses decrease significantly, freeing budget for advanced analytics, machine learning, or cloud infrastructure projects.
- Faster Time-to-Insight: Using automated conversion software like Pulse Convert accelerates project delivery from months to weeks, allowing business teams to benefit from modern cloud analytics sooner.
- Future-Ready Data Foundation: Centralizing business logic inside shared semantic models prepares your organization for next-generation AI capabilities within Microsoft Fabric and Azure OpenAI.
Free Trial / Free POC
To assess your environment's migration readiness, calculate licensing ROI, or launch a proof of concept, access a Free Trial / Free POC directly on the Azure Marketplace.
To consult with senior solution architects regarding custom enterprise requirements, feel free to Contact us today.


