Enterprise Playbook: Tableau to Power BI Migration Approach, Best Practices, and Automation
 0|
0| 0
0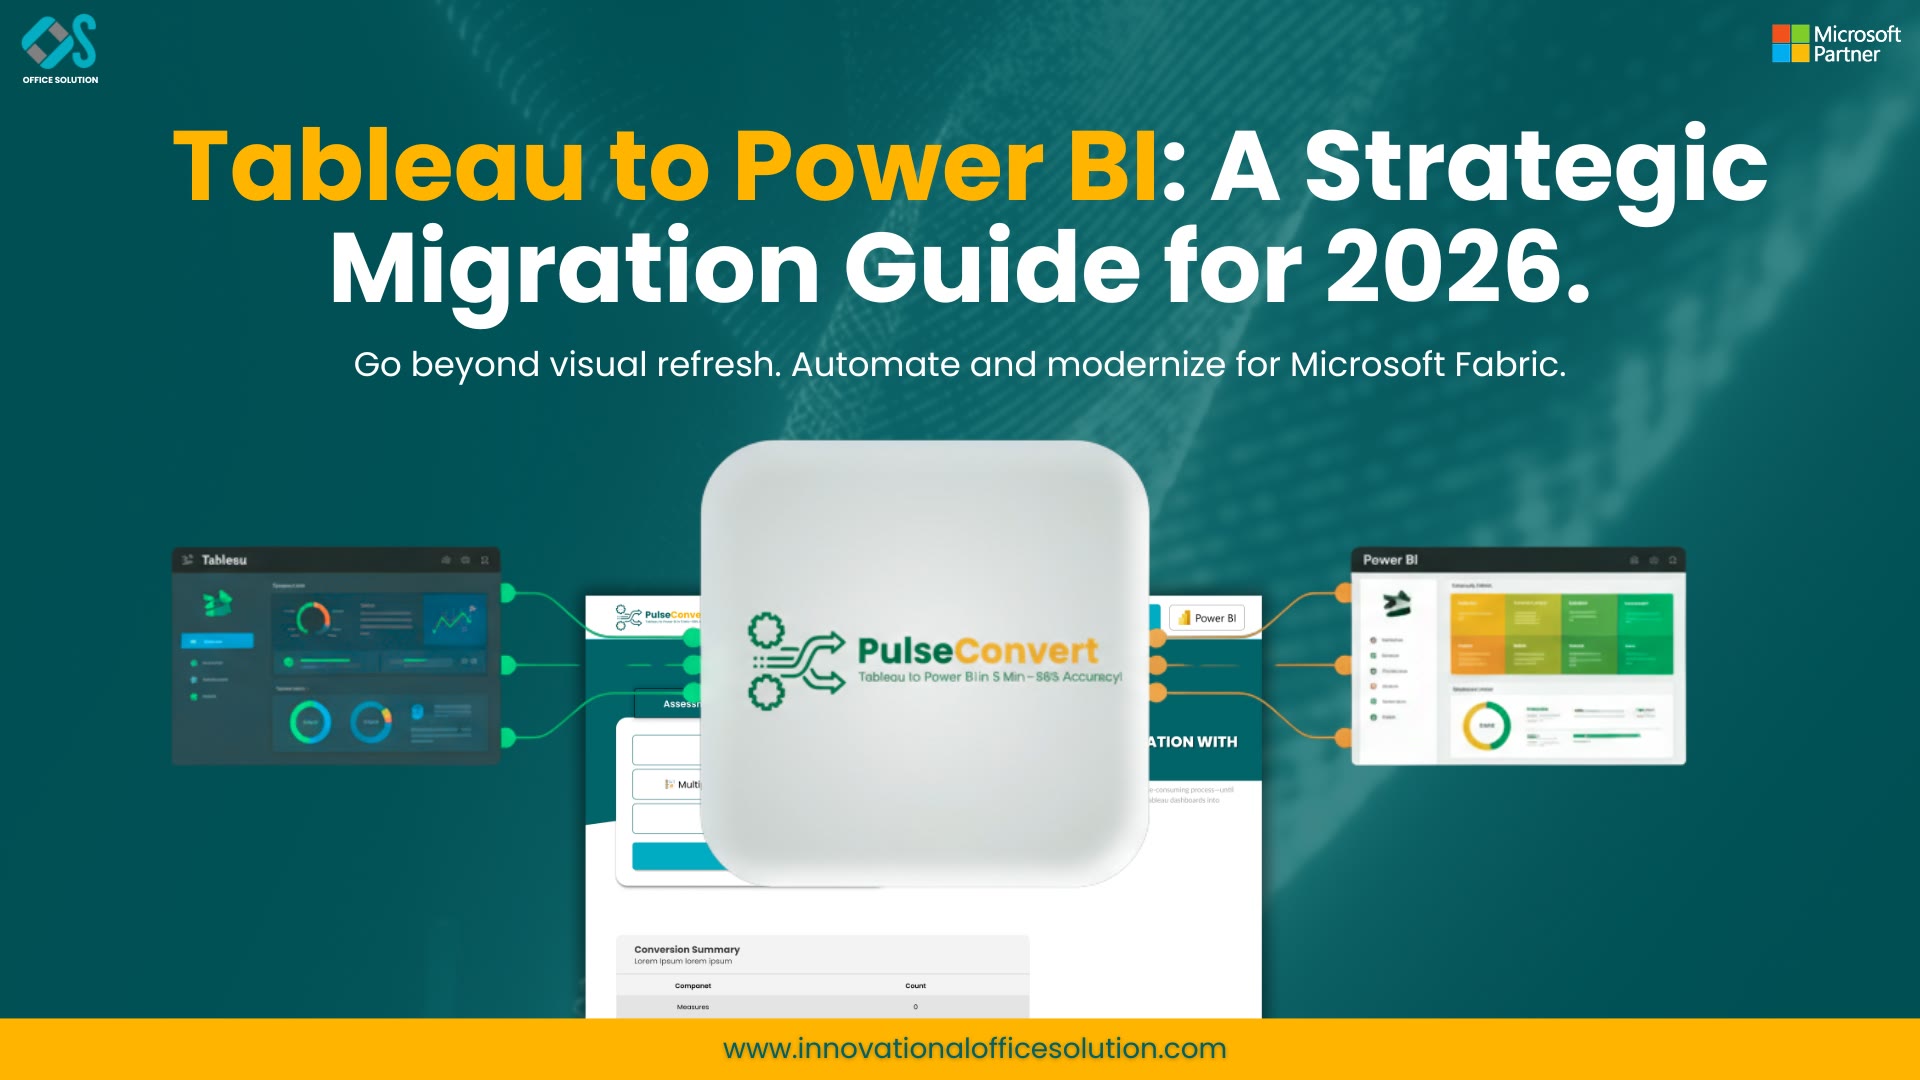
Table of Contents
The Executive Overview: The BI Automation Revolution
Enterprise analytics is undergoing a major shift toward automated, cloud-native architectures. As corporate data teams seek to lower software licensing costs, improve data governance, and standardize on Microsoft Fabric, modernizing legacy visual reporting assets has become a top priority. However, executing an enterprise-wide platform transition introduces technical complexities that require a carefully planned Tableau to Power BI approach.
Historically, platform conversion projects involved slow, manual dashboard reconstruction. BI developers spent months recreating chart layouts, rebuilding data connections, and manually rewriting complex formulas into Data Analysis Expressions (DAX). Today, applying an AI-powered Tableau to Power BI migration strategy along with a dedicated BI migration automation tool completely changes this equation. By automating formula translation, visual canvas mapping, and schema extraction, data teams can overcome common Tableau to Power BI migrating challenges and deliver high-performance cloud reporting in weeks rather than months.
This enterprise playbook outlines proven methodologies for architects and IT executives. It covers essential Tableau to Power BI migration best practice guidelines, addresses major technical challenges, and details how an automated dashboard migration Tableau to Power BI workflow minimizes risk while maximizing ROI.
Strategic Framework: Defining Your Tableau to Power BI Approach
Selecting the right Tableau to Power BI approach depends on your organization's scale, reporting complexity, and data governance maturity. Recreating legacy dashboards chart by chart—often called a "lift-and-shift" method—frequently fails because it transfers outdated workarounds, unoptimized queries, and redundant reports into the new platform.
Enterprise data leads recommend three main strategies for modernizing analytics environments:
The "Semantic Layer First" Architecture
The most effective Tableau to Power BI approach prioritizes decoupling data modeling from visual report layers. As detailed in cloud architecture guidance on the Microsoft Tech Community, architects first consolidate underlying data sources, star schemas, and business calculations into a centralized Power BI Semantic Model (or Fabric Lakehouse semantic dataset). Individual visual reports then connect directly to this shared semantic layer, guaranteeing metric consistency across business units.
Domain-Driven Phased Rollout
For large enterprises with thousands of published reports, switching platforms all at once carries operational risk. A phased rollout divides the reporting repository by business domain (such as Finance, Supply Chain, Sales, and Human Resources). Each department undergoes inventory rationalization, automated report conversion, user acceptance testing (UAT), and training before legacy reports are retired.
AI-Automated Conversion with Expert Refinement
This hybrid strategy leverages specialized conversion tools to handle 75% to 90% of the workbook conversion automatically. Once the automation engine creates foundational Power BI project files, BI engineers review the output, optimize DAX formulas, fine-tune visual layouts, and add dynamic interactive features like drill-throughs and bookmarks.
Overcoming Key Tableau to Power BI Migrating Challenges
Data engineering teams frequently encounter technical obstacles during platform conversion projects. Anticipating these Tableau to Power BI migrating challenges allows teams to implement proactive solutions early in the project lifecycle:
Translating Level of Detail (LOD) Expressions to DAX
Legacy workbooks rely on LOD expressions (FIXED, INCLUDE, EXCLUDE) to calculate metrics at specific granularities regardless of canvas filters. Power BI handles granular calculations using DAX filter context. Translating complex LOD calculations requires combining CALCULATE with context modifier functions like ALL, ALLEXCEPT, or REMOVEFILTERS. Misinterpreting evaluation context during manual conversion can lead to subtle metric errors in executive dashboards.
Unwinding Data Blends into Relational Star Schemas
Legacy workbooks frequently use client-side "Data Blending" to join disparate data sources at the worksheet level. While convenient for quick analysis, data blending causes query performance bottlenecks on large datasets. During conversion, client-side blends must be replaced with well-structured backend star schemas linked by explicit relationships in Power BI's VertiPaq engine.
Re-architecting Custom SQL and Proprietary Extracts
Legacy environments often contain workbooks built on unoptimized custom SQL queries or proprietary data extracts. Shifting to Power BI provides an opportunity to push data transformations upstream into cloud database views, dbt models, or Power Query (M) transformations, improving overall query efficiency.
Managing Interactivity, Slicers, and Parameter Actions
While both tools offer interactive filtering, their visual controls differ. Legacy action filters and sheet-swapping parameter setups are replaced in Power BI using native Field Parameters, dynamic visual containers, bookmarks, and cross-filtering controls.
Introducing Pulse Convert: The Premier BI Migration Automation Tool
Manual conversion requiring developers to recreate layouts and rewrite formulas by hand is no longer practical for enterprises managing dozens or hundreds of reports.
To solve this challenge, Office Solution AI Labs built Pulse Convert, an industry-leading BI migration automation tool engineered specifically to simplify platform modernization. Introducing Pulse Convert into your development pipeline transforms complex manual reconstruction into a streamlined, automated process. Pulse Convert directly reads legacy workbook files (.twb and .twbx), parses underlying XML metadata, extracts data connections, translates formula logic, maps visual canvas elements, and constructs native Power BI project files (.pbix).
By combining advanced formula parsing algorithms with intelligent layout mapping, Pulse Convert delivers an automated accuracy rate of 75% to 90% across standard workbooks, calculated fields, parameters, and visual layouts. This high precision reduces manual engineering effort by up to 60%, slashes conversion costs, and ensures complex business calculations are accurately translated into optimized DAX measures. Data architects seeking an automated dashboard migration Tableau to Power BI solution consistently select Pulse Convert for enterprise transitions.
To explore how this technology can accelerate your organizational transition, review the capabilities available at Office Solution AI Labs.
The Value of AI-Powered Tableau to Power BI Migration
Applying artificial intelligence to analytics engineering has transformed legacy software modernization. An AI-powered Tableau to Power BI migration framework goes beyond traditional deterministic script translation by applying semantic analysis to report conversion.
Key advantages of AI-driven conversion include:
- Semantic Formula Interpretation: Traditional conversion scripts often struggle with complex nested formulas or custom table calculations. AI translation models analyze the intent of original calculations and generate clean, performant DAX patterns that evaluate efficiently within the Power BI engine.
- Automated Visual Canvas Reconstruction: AI conversion engines analyze layout density and visual relationships, mapping charts, tables, slicers, and dynamic indicators into clean Power BI layouts while preserving custom color palettes and typography.
- Automated Data Parity Testing: Machine learning algorithms compare query outputs generated by both platforms, quickly identifying discrepancies in metric totals, date handling, or null values across millions of rows.
Using an automated dashboard migration Tableau to Power BI workflow powered by AI minimizes human error, standardizes DAX syntax across teams, and speeds up project completion.
Essential Tableau to Power BI Migration Best Practice Rules
Following proven Tableau to Power BI migration best practice guidelines helps enterprise teams avoid common project delays and maintain high data quality throughout the transition:
Rule 1: Rationalize Your Inventory Before Conversion
Do not convert unoptimized legacy workarounds or abandoned reports. Audit usage logs from server metadata to eliminate unused workbooks, consolidate redundant views, and focus migration effort exclusively on active, high-value reports.
Rule 2: Prioritize Semantic Modeling Over Pixel Copying
Focus on building reusable star-schema datasets rather than trying to recreate legacy dashboard layouts pixel for pixel. Establishing central semantic models reduces data duplication, improves query performance, and simplifies future report authoring.
Rule 3: Enforce Standardized DAX Conventions and Governance
Define clear DAX measure naming rules, organize calculations into dedicated measure folders, and document complex formulas. Establishing DAX coding standards early prevents technical debt and ensures maintainability.
Rule 4: Validate Data Parity with Parallel Testing
Run parallel testing during user acceptance testing to ensure key metrics match exactly across old and new platforms under identical filter conditions. Validating data precision early builds end-user trust in the new Power BI environment.
Step-by-Step Automated Dashboard Migration Workflow
An automated dashboard migration Tableau to Power BI project follows a structured five-stage technical workflow:
Metadata Parsing
The conversion tool parses legacy workbook XML schemas (.twb/.twbx), extracting data connection strings, metadata aliases, visual positions, and calculation logic.
Schema Mapping & Dataflow Generation
Data connection sources are mapped directly to Power Query M statements or database connections, establishing relational star schemas.
AI Formula Translation
Embedded calculations and LOD expressions are translated into optimized DAX measures using semantic formula mapping.
Visual Canvas Generation
Visual elements, charts, matrix tables, and slicers are mapped onto native Power BI report canvases, preserving layout structure, fonts, and hex color codes.
Validation and Deployment
Data engineers review converted files, validate calculation outputs, optimize DAX query execution paths, and deploy finalized reports to target Power BI Workspaces.
Maximizing Value and Long-Term Analytics Strategy
Modernizing your enterprise reporting environment by adopting a structured Tableau to Power BI approach delivers lasting financial and operational advantages. By combining cloud-first semantic modeling, automated conversion software like Pulse Convert, and rigorous governance practices, technology leaders can successfully migrate reporting workloads with complete confidence.
The benefits of this modernization strategy ripple across the entire organization: software licensing costs drop significantly, data engineering teams improve development velocity, and decision-makers gain access to fast, AI-powered analytics embedded directly within their daily Microsoft tools.
Free Trial / Free POC
To assess your organization's migration readiness, test conversion speed on your own workbooks, and experience automated report generation firsthand, launch a Free Trial / Free POC directly on the Azure Marketplace.
To schedule a technical consultation with senior solution architects, feel free to Contact us today.


