Complete Enterprise Strategy for Tableau to Power BI Migration
 0|
0| 0
0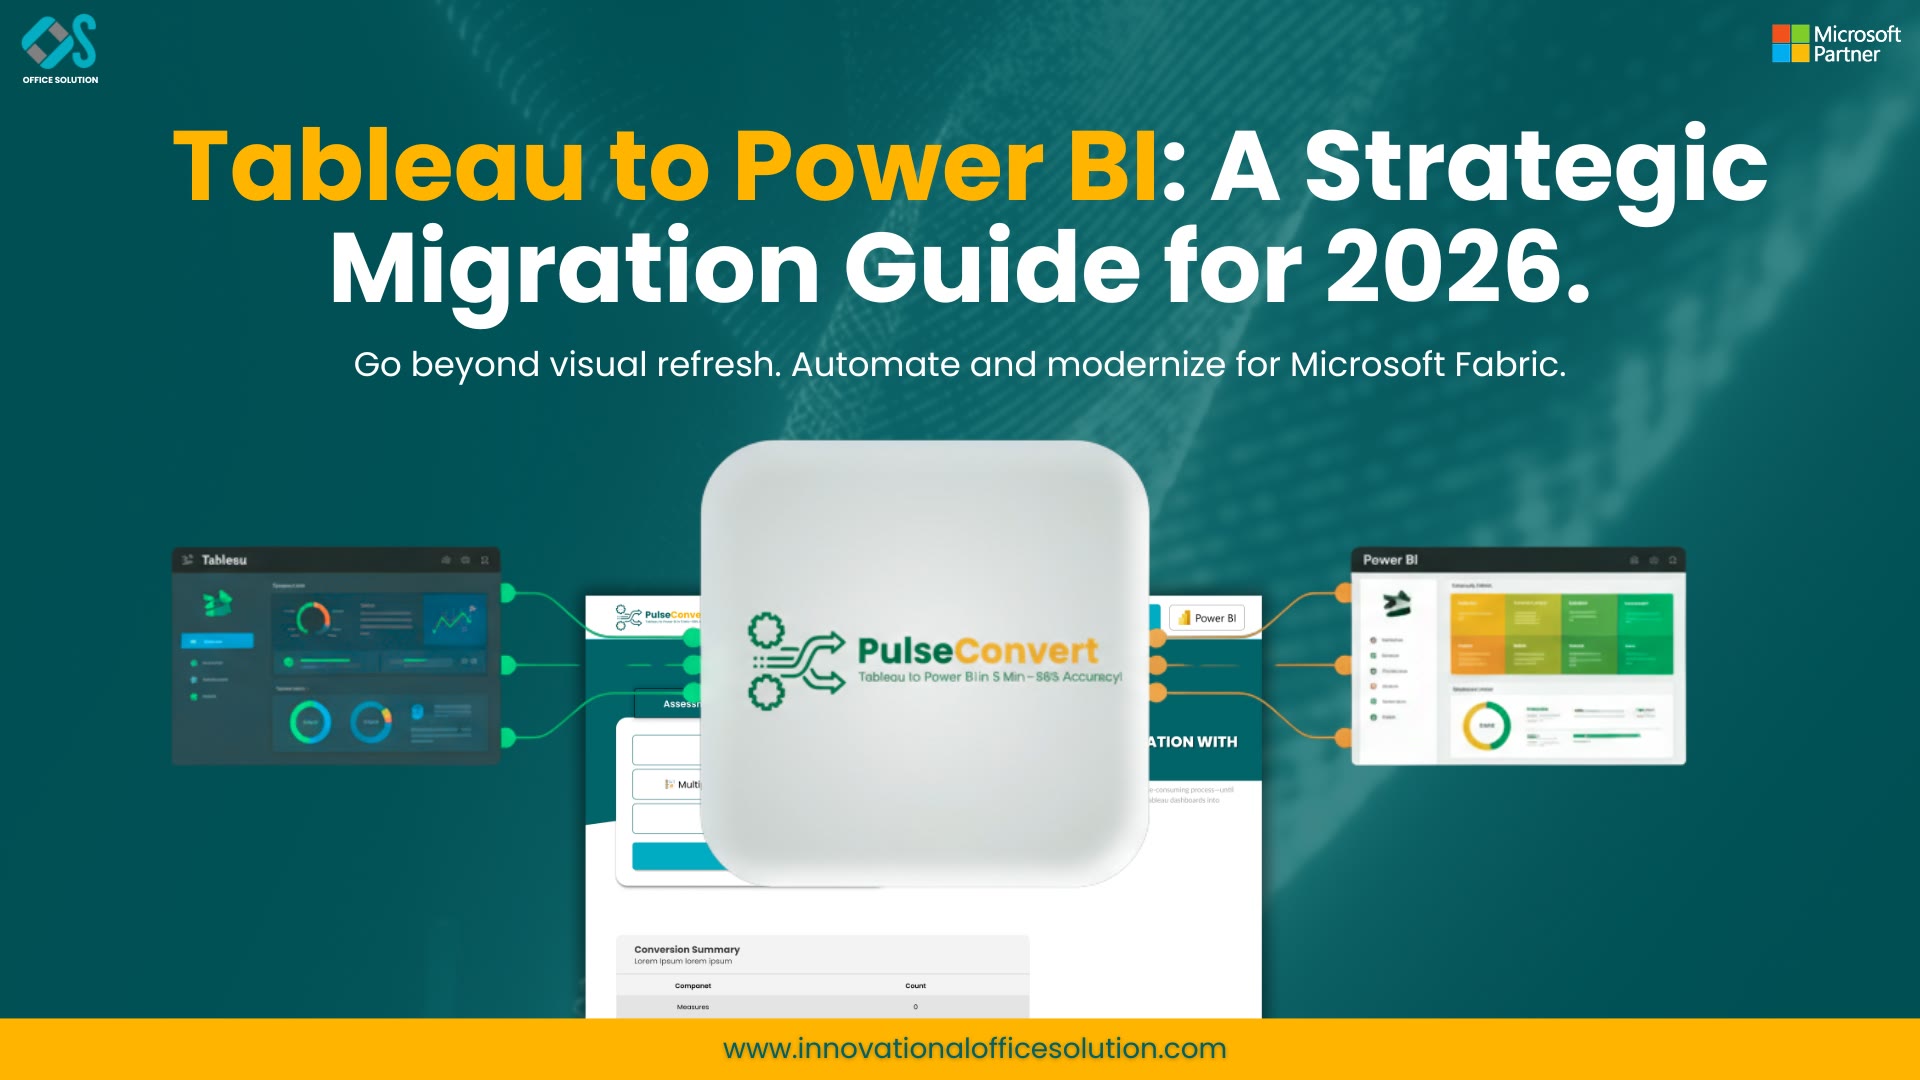
Table of Contents
Executive Summary: Modernizing Enterprise Business Intelligence
Enterprise business intelligence is undergoing a seismic shift as digital-first organizations consolidate their data analytics platforms. For years, standalone visual discovery software served as the gold standard for exploratory reporting. However, in today’s enterprise environments, isolated reporting platforms create operational friction, duplicated data engineering efforts, and high licensing overhead. Consequently, technology leaders across global enterprises and fast-growing digital markets are executing strategic initiatives to migrate from Tableau to Power BI.
Transitioning your enterprise reporting infrastructure involves far more than simply replacing chart components. When companies choose to convert Tableau to Power BI, the primary goal is building a scalable, unified analytics ecosystem. Modern organizations require seamless integration with cloud data warehouses, central data governance through tools like Microsoft Purview, and native AI capabilities like Copilot embedded directly into daily reporting workflows. A well-executed migration allows decision-makers to lower total cost of ownership while democratizing self-service data insights across thousands of business users.
To achieve a seamless transition without business disruption, IT leaders must adopt a structured Tableau to Power BI migration strategy. This strategy encompasses comprehensive asset inventory, semantic model architecture, automated formula translation, and proactive change management. Without a proven execution framework, teams risk transferring technical debt, creating metric discrepancies between departments, and delaying platform adoption.
The Strategic Drivers Behind Platform Modernization
Chief Information Officers and Chief Data Officers are increasingly re-evaluating legacy reporting stacks to align with enterprise cloud modernization goals. While Tableau built a strong reputation for visual exploration, managing decentralized server workbooks at enterprise scale often leads to severe governance and cost challenges.
Organizations deciding to migrate from Tableau to Power BI are typically driven by four major strategic imperatives:
- Drastic Total Cost of Ownership (TCO) Reduction: Maintaining standalone creator, explorer, and server licenses for large user bases creates escalating annual software costs. Transitioning to Power BI leverages existing Microsoft 365, Azure Enterprise Agreements, or Microsoft Fabric capacities, frequently cutting licensing expenses by 60% to 75%.
- Centralized Semantic Layer and Governance: In legacy reporting environments, business calculations and data blends are often embedded directly inside individual workbooks. Migrating to Power BI allows organizations to centralize business logic within shared semantic models, enforcing single-source-of-truth governance and standardized key performance indicators (KPIs).
- Native Artificial Intelligence and Generative Analytics: Power BI natively integrates Copilot and automated machine learning features directly into reports. Business users can query datasets using natural language, generate automated summaries, and perform root-cause decomposition without requiring advanced SQL or DAX knowledge.
- Ecosystem Interoperability and Cloud Alignment: Modern data architectures rely on unified cloud lakehouses like Delta Lake, Snowflake, Databricks, and OneLake. Power BI provides direct, high-performance connectivity to these environments through DirectQuery and Direct Lake modes, eliminating the need to extract and store duplicate data copies.
Introducing Pulse Convert: Automated AI Migration Acceleration
Rebuilding hundreds of complex enterprise dashboards manually represents a major operational bottleneck. Re-creating visual layouts, re-establishing data source connections, and manually rewriting complex calculated fields consumes thousands of developer hours and introduces significant human error into mission-critical financial calculations.
To address this challenge, Office Solution AI Labs created Pulse Convert, an enterprise-grade automated conversion engine engineered specifically to streamline and accelerate your transition. Introducing Pulse Convert into your modernization workflow moves your team away from manual, repetitive development toward an automated, highly efficient conversion process. Pulse Convert programmatically parses legacy workbook XML structures, extracts calculation logic, maps underlying data schemas, and constructs native Power BI report templates (.pbix files) and semantic models.
By leveraging intelligent pattern recognition and automated DAX translation algorithms, Pulse Convert achieves an automated accuracy rate of 75% to 90% across standard workbooks, calculated fields, dynamic parameters, and visual canvas layouts. This high level of automation reduces overall project delivery timelines by up to 60%, drastically decreases conversion costs, and allows data engineers to focus their expertise on high-value data modeling, security configuration, and performance tuning. To learn more about how this technology can transform your BI environment, explore the complete migration capabilities available at Office Solution AI Labs.
Evaluating the Core Architectural Differences
Engineers tasked with executing a project to convert Tableau to Power BI must thoroughly understand the foundational architectural differences between the two environments. While both platforms deliver rich interactive visuals, their underlying data engines, calculation mechanics, and storage models operate on distinct principles.
Calculated Fields vs. DAX Filter Context
In legacy workbooks, calculations operate primarily on rows or aggregated views defined by worksheet layout dimensions. In Power BI, metrics are governed by Data Analysis Expressions (DAX) evaluating within a dynamic filter context.
For instance, translating Level of Detail (LOD) expressions requires mapping fixed dimensional scopes into DAX patterns combining CALCULATE with filter overrides like ALL, ALLEXCEPT, or REMOVEFILTERS. Pulse Convert automatically translates these complex formulas, ensuring mathematical logic remains completely consistent across both reporting tools.
Client-Side Data Blending vs. Star Schema Modeling
Legacy reports frequently utilize client-side "Data Blending" to join separate data sources at the worksheet level. While convenient for ad-hoc analysis, data blending creates severe performance degradation on large datasets.
During a structured transition, data blending is eliminated in favor of robust relational star schemas in Power BI. Fact tables and dimension tables are linked through explicit relationships evaluated directly within Power BI's high-performance VertiPaq memory engine, delivering instantaneous query responses across millions of records.
Interactive Slicers, Bookmarks, and Navigation
Both tools support dynamic user interaction, but their visual implementation differs:
- Filtering Logic: Legacy reports rely on cascading context filters and sheet highlight actions. Power BI uses interactive visual cross-filtering, sync-slicers, page-level filters, and field parameters.
- Dynamic Views: Switching between metrics or visual types in legacy tools requires complex sheet-swapping parameter tricks. Power BI accomplishes this cleanly using native Field Parameters, dynamic visual containers, and bookmark state management.
A 5-Phase Roadmap for Seamless Migration
Executing a successful enterprise transformation requires a disciplined, multi-stage roadmap. Following these structured phases ensures technical accuracy, zero business disruption, and rapid end-user adoption:
Phase 1: Portfolio Discovery and Asset Rationalization
Begin by auditing your entire workbook repository using server metadata. Categorize reports into four operational buckets:
- Retire: Unused or obsolete reports with zero views over the last 90 days.
- Consolidate: Redundant dashboards across departments that can be combined into a single interactive Power BI report.
- Re-architect: Highly complex workbooks that require redesigning underlying data sources into cloud data warehouse views.
- Convert: High-value, active reports selected for direct migration.
Phase 2: Foundation and Semantic Model Architecture
In alignment with best practices published in the Microsoft Tech Community, build a centralized semantic layer before creating individual visual reports. Define reusable star schemas, establish shared dimension tables, and construct certified DAX measures inside central Power BI semantic models or Microsoft Fabric Lakehouses.
Phase 3: Automated Conversion and DAX Refinement
Incorporate Pulse Convert to parse prioritized workbooks, map visual elements, and automatically generate foundational DAX logic. Data engineers then perform focused code reviews, optimizing query execution paths and refining advanced calculation patterns.
Phase 4: Data Parity Validation and Performance Tuning
Run rigorous parallel testing to validate that key metrics match down to the cent across both platforms. Use Power BI Performance Analyzer and DAX Studio to optimize DAX query speed, ensuring visual rendering times stay well under target SLA thresholds (under 2 seconds).
Phase 5: Enterprise Deployment and User Enablement
Publish finalized semantic models and reports to secure Power BI Workspaces. Configure Row-Level Security (RLS) policies, set up automated gateway data refresh schedules, and deliver targeted training sessions to help business users master Power BI's interactive interface.
Maximizing Value and Long-Term ROI
A strategic Tableau to Power BI migration delivers transformative long-term value across the modern enterprise analytics stack:
- Substantial Cost Savings: Releasing expensive legacy licenses frees up significant IT budget that can be reallocated toward advanced analytics, predictive modeling, or cloud AI initiatives.
- Accelerated Time-to-Value: Utilizing automated acceleration tools like Pulse Convert reduces project execution timelines from months to weeks, enabling faster realization of modern cloud analytics capabilities.
- Future-Ready Analytics Stack: Establishing unified semantic models inside the Microsoft ecosystem positions your enterprise to seamlessly adopt future innovations in Microsoft Fabric, Azure OpenAI, and agentic workflows.
To assess your environment's migration readiness, calculate prospective licensing ROI, or initiate a hands-on proof-of-concept, launch a Free Trial / Free POC directly on the Azure Marketplace. To consult directly with senior migration architects regarding custom enterprise requirements, please Contact us today.
Get Pulse Convert on Azure Marketplace
To assess your environment's migration readiness, calculate prospective licensing ROI, or initiate a hands-on proof-of-concept, launch a Free Trial / Free POC directly on the Azure Marketplace.
Speak with Our BI Migration Experts
To consult directly with senior migration architects regarding custom enterprise requirements, please Contact us today.
Featured In Press Releases